Social Media Design, Sustainable Design
Samuel Tomé - Designer & Research
A collection of Social Media posts and images that aims to bring more awareness to the Climate Crisis and our impact as Human individuals.
Each post consists of 10 slides where I aim to summarize various extensively researched topics into bite-sized images that tell a story and educate people of all ages.Through Infographics and Illustrations, I represent the data and facts in a way that it's easy and fast to read - perfect for the Social Media reading flow.


Showcasing some slides from a series of 3 posts explaining the Climate Crisis, how it affects us and what society needs to do to stop it.

This post shows some love for Bees and their importance, with a touch of humor. It also highlights their species' risks and how anyone could help restore their population.

Researching & Summarizing Extensive Studies for the Public.
Each of these posts started with a topic I wanted to shine more light on, and once the concept of what I would be explaining was developed, I started the research phase.
This is the phase where I collect, analyze, and compare all the information for the specific subject mentioned in each post. Behind each topic addressed in these posts, there was extensive research on various sources, to confirm and question the data given to the general consumer.

Many of the topics highlighted were directly correlated to big industries in our capitalist society, such as the Milk, Meat, and Transportation industries.
When researching for facts related to big industries and companies, it's important to keep in mind that studies and papers can be bought and published by companies to push a certain view to sell their product.
Therefore, it's critical to read, collect, and verify multiple sources and always question if a source is reliable.
All the Sources used for each research are linked together in each post caption, or inside the images themselves for credibility and full transparency.
From various Sketches to the Finalized Illustrations.
Once the research phase is finalized, I start deciding on the best and shortest text for each slide and how they could be combined.
I experimented with various ways the text and concepts could be translated into small illustrations and infographics. By summarizing and illustrating the complex and heavy information, it's easier for the reader to understand it at a glance.


"I believe that Art is the language that all nations understand."
- Samuel Tomé.
At the time (2020), and for a very long time, the Instagram platform had a limit of 10 image or video Slides.
Only having 10 slides meant to explain extensive research documents and showcase a real-world problem is a very limiting number.
However, it was also an enjoyable challenge to conform to this constraint, ensuring the message was concise and comprehensible.
To accomplish this, I had to select my wording and focus on the essential points to convey it.
The Finalized Educative Posts on Sustainability
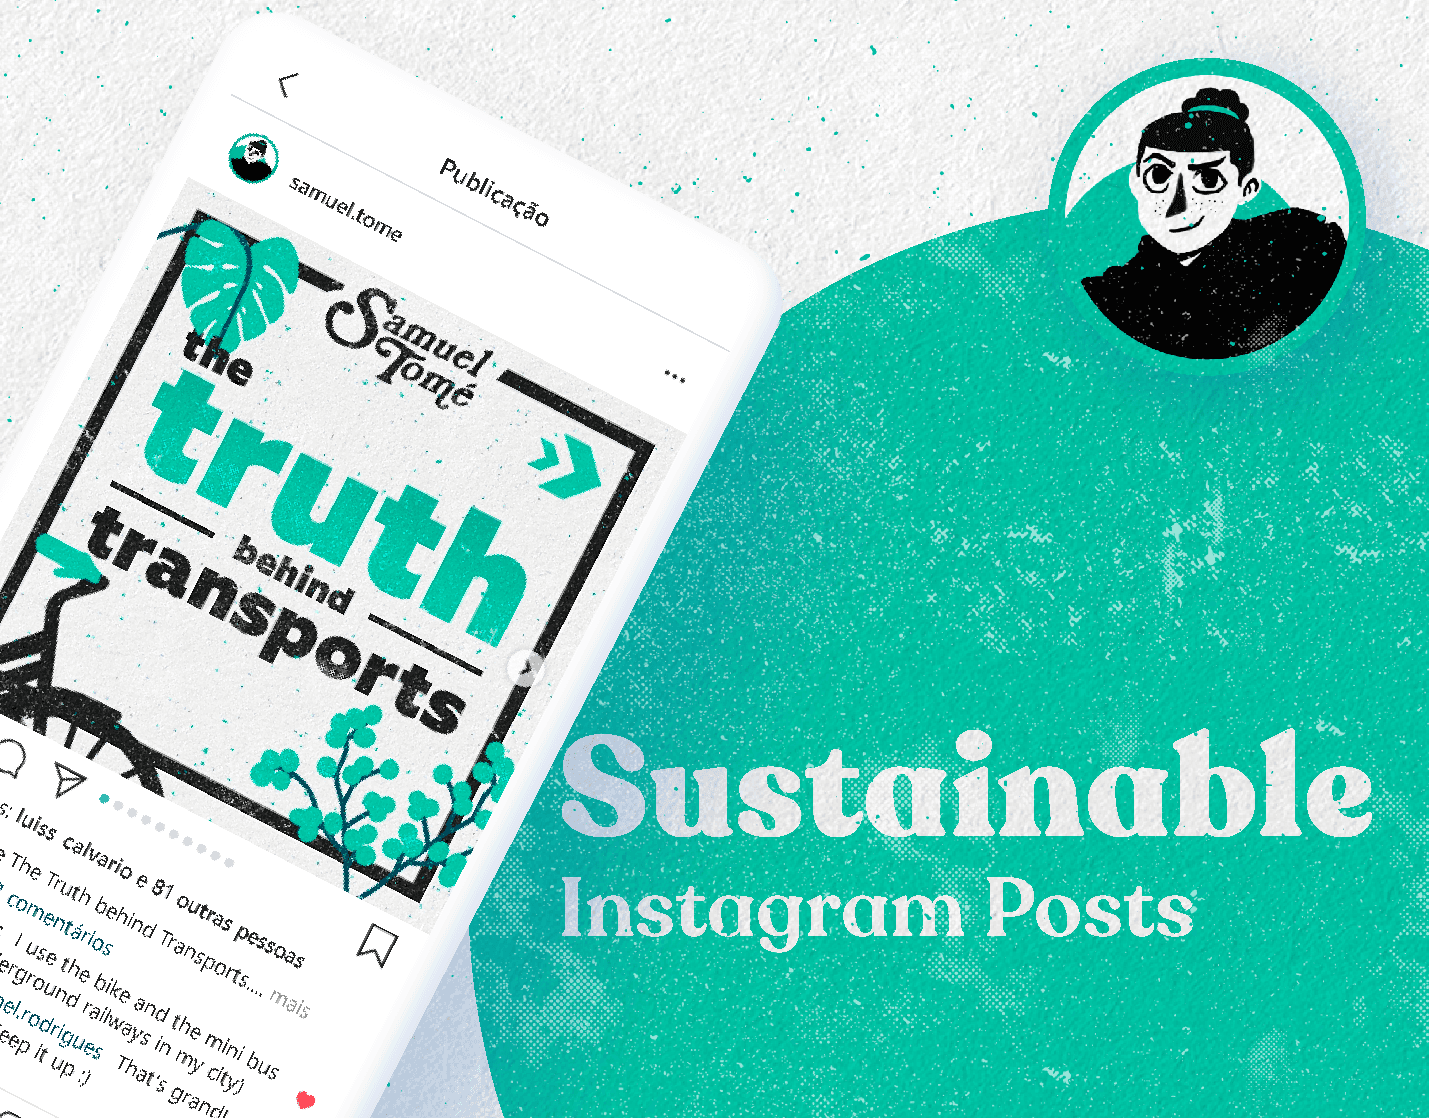
All these Projects were published to my Instagram account (@samuel.tome) as Carousel Posts, publications with various image slides shown on people's social media feeds.
These publications were shared by various people who wanted to spread the message and information presented, either by showing them to their families or by sharing my Posts through their accounts.
With each publication, the online community created a chain of education and enlightenment, gradually reaching more people with each share!

I played and experimented with the platform's slide features by creating playful images that show a different perspective on each slide.
This creates fun and interactive moments where the person seeing it goes back and forth between the slides to compare them or stops in between a slide to read.
A post comparing various milk alternatives and how bad the Cow's Milk Industry is for the planet and ourselves.

This post highlights how we, as individuals, could reduce the gifting holiday packaging waste.

A New Year's Eve Instagram Post showcasing actionable ways everyone could have a positive impact and reduce their carbon footprint.

Comparing different methods of transportation by their sustainability. Which ones are the worst, and are electric alternatives any better?


This project was very insightful, and I'm so happy that it was part of my career as a Designer.
It allowed me to study and expand my skills by researching and representing data through minimalistic infographics.
Thank you for reading about my process for this collection of posts on Sustainability.
You can follow me on Instagram to keep up with my latest work and see these posts!